Tuning the standard algorithm: Holy Grail shouldn’t hold Coca-Cola
Tuning the standard algorithm may sound dangerous and intriguing at the same time. As many sophisticated researchers have cross-checked the benefits of algorithms, some might think this is too controversial. But you can compare these two: a latte mug and, yes–the Holy Grail.
First, what is the benefit of a latte mug?
This is made under the shade of modern industry, which means it can perform well with any kind of soda. However, it cannot symbolize divinity on its own, nor can it bless someone who owns it.
How about the Holy Grail?
This was made when St. Peter was still alive, which means it can be damaged by Coca-Cola. However, the Holy Grail can symbolize the sacrifice of Jesus, and it can bless somebody who is sincere.
This is the difference in prestige.
Then, let’s think about standard BBRv3 and a tuned one.
The standard one is a latte mug. It can hold any sort of beverage, but it is hard to use when celebrating Mass.
The tuned one is an imitation of the Holy Grail. If we define the Holy Grail as “a flawless algorithm for specific problems,” then this is an imitation of it. This means it is good enough to hold wine and bread.
Let’s think about BBRv3: Balance & Options
Simply, BBRv3 aims for harmony. This means it will not aggressively scale its transmission rate only for itself.
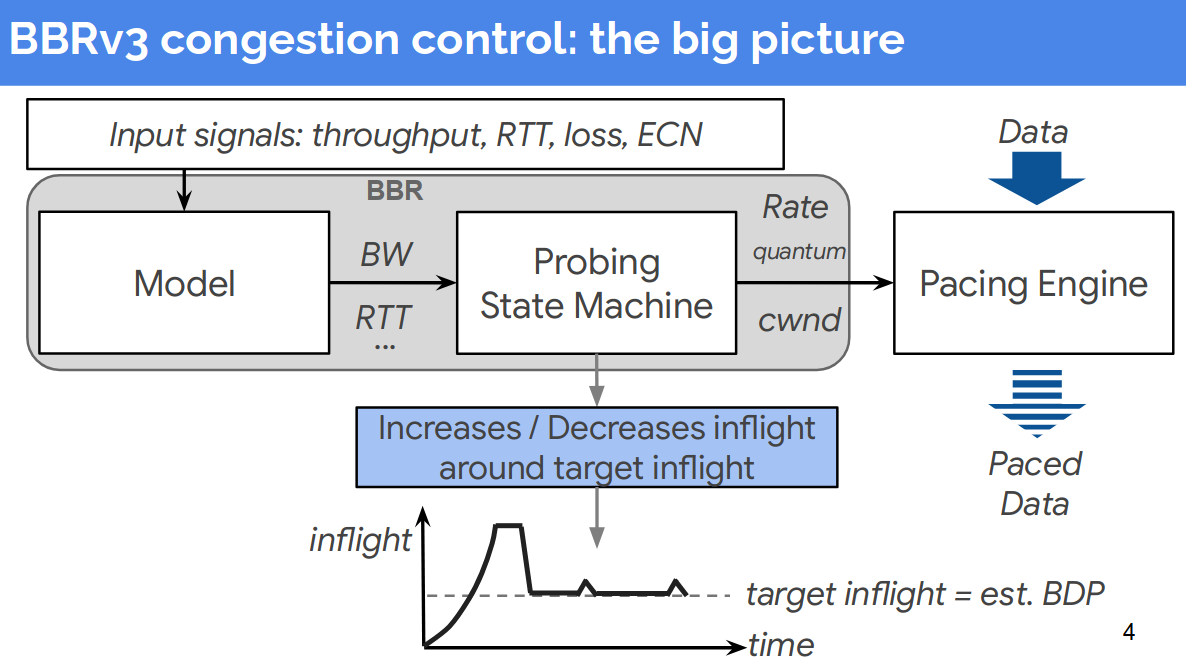
Balance
As you can see in the picture, the pacing engine controls the transmission pace using calculated metrics from the probing state machine. This means the pacing engine will behave consistently based on the given metrics. If you are running a Kubernetes cluster with this congestion control logic, this is ideal.
Options
However, if you are maintaining real-time game servers that must guarantee HA (High Availability), there are some good points to tune.
BBRv3 is still prone to sudden metric changes, although many experiments prove that it is much improved compared to legacy algorithms (like Cubic or Vegas), especially in worse cases.
I will explain this with a friendly example: cars.
BBRv3 is just like an F1 racing car from Ferrari. It has a strong accelerator pedal and a brake pedal, but it will not provide intelligent deceleration for you. So, if you are driving this car on a track, it is the best fit. But what would happen if you drive this car in rush-hour traffic in Seoul? You will have trouble controlling it.
Then you will need intelligent features like AI deceleration, which are commonly found in modern sedans.
Plan
As a result, we can build a plan based on this metaphor.
- Reduce CWND (Congestion Window) when metrics get too bad.
- Make a custom metric with previous bandwidth records.
- Use this metric to reduce pacing.
How can I implement this?
Since the source of BBRv3 is simple and clear, we can easily plan how to implement it. When looking at the bit-field, there are unused bits. If we are planning to reduce CWND, we need a switch bit to trigger it. So, we can use an additional 1 bit to mark this information.
| reduce_cwnd | .. | .. | .. | .. |
|---|---|---|---|---|
| 1 bit | - | - | - | - |
Also, we must store a pacing-gain ratio to remember how much we should reduce pacing.
As a result, we need a new member in struct bbr.
struct bbr {
// ... other members
    alpha_last_delivered_ce; // insert below this line!
	u32	pacing_gain_extra;
};
Then, we should define the thresholds to trigger reduce_cwnd and control pacing, which are applied inside the pacing engine.
	#define BW_DELTA_ALPHA        (BBR_UNIT / 2) // the ratio for limiting reduce logic: 50%. reduce 20% when throughput is 40% dropped
	#define BW_DELTA_CEILING      (BBR_UNIT / 4) // max pacing reduce ratio: 25%
	#define BW_DELTA_FLOOR        (BBR_UNIT * 3 / 4) // when calculated pacing gain is dropped below 75%, turn on reduce_cwnd.
Add this to bbr_init to initialize the bit and variable.
// ... rest of the codes are omitted...
		bbr->pacing_gain_extra = BBR_UNIT;
		bbr->reduce_cwnd = 0;
// ...
Declaring functions (Concept only)
This section is a conceptual sketch to explain the idea; refer to the repo commit for the actual 6.18 port.
Names/fields may differ from upstream BBRv3 depending on kernel version.
	static void bbr_tweak_pacing_reduction(struct sock *sk, u32 sample_bw, u32 old_bw)
	{
		struct bbr *bbr = inet_csk_ca(sk);
		u32 max_bw_val = bbr_max_bw(sk);

		if (!max_bw_val || sample_bw >= old_bw) {
			bbr->pacing_gain_extra = BBR_UNIT;
			return;
		}

		u64 delta = ((u64)(old_bw - sample_bw) * BBR_UNIT) / max_bw_val;
		u64 reduction = (delta * BW_DELTA_ALPHA) >> BBR_SCALE;

		if (reduction > BW_DELTA_CEILING)
			reduction = BW_DELTA_CEILING;

		bbr->pacing_gain_extra = BBR_UNIT - (u32)reduction;
		bbr->reduce_cwnd = 0;

		if (bbr->pacing_gain_extra < BW_DELTA_FLOOR) {
			bbr->reduce_cwnd = 1;
			if (bbr->pacing_gain_extra < BBR_UNIT / 8)
				bbr->pacing_gain_extra = BBR_UNIT / 8;
		}
	}
First, this calculates whether to slow down or not.
And apply this to bbr_main:
// ... rest of the codes are omitted...
		if (rs->interval_us > 0 && rs->acked_sacked > 0) {
			if (!rs->is_app_limited || ctx.sample_bw >= bbr_max_bw(sk))
				bbr->bw_hi[1] = max(bbr->bw_hi[1], ctx.sample_bw);

			bbr_tweak_pacing_reduction(sk, ctx.sample_bw, old_bw); // this line has inserted to adjust pacing rate metric

			if (bbr->round_start) {
				bbr->bw_hi[0] = bbr->bw_hi[1];
				bbr->bw_hi[1] = 0;
			}
		}
// ...
Add this to bbr_set_cwnd:
// ... rest of the codes are omitted...
	if (!acked) goto done; // insert below this line
	if (bbr->reduce_cwnd) {
		cwnd = max_t(s32, cwnd - acked, 1);
		bbr->reduce_cwnd = 0;
	}
// ...
Materials
A router is 100M full-duplex router (Ssamji Electronics, P405N), and 1000M full-duplex router(ipTime BE3600QCA) on 500M full duplex WAN.
BBRv3 baseline commit hash is 90210de4b779d40496dee0b89081780eeddf2a60.
The modified algorithm was ported from the base commit to Linux 6.18(6.18.0 based, Released as Mountain Kernel v0.3) and published at https://github.com/gg582/linux-mountain commit c62bcddd7a829dec76ae2ef52b540cb86073e9c5. The relevant sources are net/ipv4/tcp_bbr3.c and net/ipv4/tcp_bbr3vanilla.c.
QDisc was forced to fq.
Simple CPU load tool’s code is uploaded with test scripts.
Test scripts are at mountain_kernel_ping_test(commit hash 1b5950c7125b156b4adc66757487b1e807df6b79).
For Ping measurements, CPU load was forced to 100 percent while running the tests. For IPerf3 measurements, I kept my base CPU load to 1%-5%. I used two scripts: one is a public iPerf3 CC switch benchmark that fixes a single best server for the whole session and runs forward and reverse iperf3 while pinging during load, and the other is the original ping-test template that runs long local and WAN pings and optionally iperf3 and turbostat.
Fairness and Measurement Rationale
This post compares two congestion control implementations under two different experimental goals:
-
Ping tests (bufferbloat / tail latency focus): CPU load was intentionally forced to 100% to emulate a worst-case host contention scenario. The goal was to stress queueing and scheduling interactions that typically amplify RTT jitter under load, and to observe whether the modified logic reduces tail latency behavior in that environment.
-
iPerf3 tests (throughput / retransmission focus): Baseline CPU load was kept low (about 1% to 5%) to avoid turning the experiment into a CPU-bound benchmark. If the sender/receiver becomes CPU-limited, differences between congestion control algorithms can be masked or distorted by user-space overhead and scheduling artifacts rather than network control behavior.
- Same host hardware and OS userspace for both kernels (only the CC implementation differed).
- Same NIC, link, and physical path (same switch/router/cabling).
- Same queueing discipline: fq forced on the measured interface.
- Same baseline sysctls (tcp_ecn, tcp_timestamps, tcp_sack) and routing configuration.
- Same ping targets, sample size (n=1000), and ping interval/timeout settings.
- Same iperf3 parameters (duration, parallel streams, forward/reverse), with one server fixed per session after initial selection.
- For the server-fixed iperf3 session, I only considered candidates that connected successfully without any transient failures, and then picked one of those stable candidates for the session.
- Not fully controlled / known limitations (script-driven best effort):
- NIC offload and low-level NIC features were not explicitly toggled or verified (ethtool unavailable in this environment), so GSO/GRO/TSO/LRO behavior may differ from other hosts.
- CPU frequency scaling / governor, IRQ steering (irqbalance), and RPS/XPS settings were not pinned. Under high load, these can affect RTT jitter via scheduling/interrupt locality, independent of CC logic.
- Path variability outside the host was not controllable for WAN tests (ISP queueing, cross-traffic, upstream shaping, time-of-day effects). For WAN, results should be read as “under my path at that time”, not as a universal claim.
- iperf3 server-side load and policy are external variables. Even with a fixed server per session, remote contention or rate limiting can influence throughput/retransmissions.
- Repetition and reporting policy:
- Ping tests: each target was measured with n=1000 ICMP samples per run. (If multiple runs were executed, the raw logs are preserved; the table values are taken from a single representative run unless otherwise stated.)
- iPerf3 tests: forward and reverse runs were executed per CC setting in the same session, using identical duration/parallel parameters. Retries were enabled to avoid aborting on transient server busy conditions.
- Server selection fairness (iperf3):
- The server was selected once at the beginning of the session and fixed for the entire CC sequence.
- During selection, I only considered candidates that connected successfully without transient failures (no immediate connect errors/timeouts), then chose one of those stable candidates (best RTT among them) for the session.
- About the reverse table (why no extra analysis here):
- I will attach a reverse-direction table for completeness and reproducibility, but I will not add additional narrative analysis because reverse results are more sensitive to uncontrolled remote-side factors (server NIC/CPU state, receive path scheduling, and cross-traffic near the server).
- In other words, the reverse table is provided as raw evidence/log-aligned data, while the conclusions in this post are intentionally based on the more controlled aspects of the experiment (host-side conditions + consistent session setup).
The two test groups are not mixed; each is used for what it measures best. Ping emphasizes latency/jitter sensitivity to queueing, while iPerf3 emphasizes sustained transfer behavior (throughput and retransmissions) without an artificial CPU bottleneck.
Absolute Values and Test Conditions
Below are the concrete conditions used when producing the numbers shown in this post. These are listed to make the results reproducible and to clarify what was (and was not) controlled.
1000M Full Duplex
- Targets:
- LAN: ping 127.0.0.1 … all same
100M Full Duplex
Ping measurements (absolute values)
-
Targets:
- LAN: ping 127.0.0.1
- WAN: ping 1.1.1.1
- Sample size: n = 1000 (per target)
- Metrics reported: Avg RTT, mdev, p99, p99.9, Max RTT, Loss
- Host condition: CPU load forced to 100% during the ping tests
- Queueing discipline: qdisc forced to fq on the measured interface
iPerf3 measurements (absolute values)
- Measurement method: forward and reverse runs
- A single server was selected once at the beginning (best RTT among reachable candidates) and fixed for the entire session
- During each iperf3 run, ping was executed concurrently to the WAN_PING_TARGET to capture latency behavior under load
- Host condition: baseline CPU load kept low (about 1% to 5%) to reduce CPU-bound bias
- Queueing discipline: qdisc forced to fq on the measured interface
- Note: NIC offload features were not explicitly toggled (ethtool unavailable)
Environment
Server environments are attached here.
yjlee@elegant:~$ ip -details link show dev enp5s0

2: enp5s0: <BROADCAST,MULTICAST,UP,LOWER_UP> mtu 1500 qdisc fq state UP mode DEFAULT group default qlen 1000
    link/ether a8:a1:59:ea:cc:d7 brd ff:ff:ff:ff:ff:ff promiscuity 0 allmulti 0 minmtu 68 maxmtu 9194 addrgenmode none numtxqueues 1 numrxqueues 1 gso_max_size 64000 gso_max_segs 64 tso_max_size 64000 tso_max_segs 64 gro_max_size 65536 gso_ipv4_max_size 64000 gro_ipv4_max_size 65536 parentbus pci parentdev 0000:05:00.0
    altname enxa8a159eaccd7
yjlee@elegant:~$ lspci -nn | grep -i eth
05:00.0 Ethernet controller [0200]: Realtek Semiconductor Co., Ltd. RTL8111/8168/8211/8411 PCI Express Gigabit Ethernet Controller [10ec:8168] (rev 15)
root@elegant:/home/yjlee# uname -a
cat /etc/os-release
sysctl net.ipv4.tcp_congestion_control
sysctl net.core.default_qdisc
sysctl net.ipv4.tcp_ecn
sysctl net.ipv4.tcp_timestamps
sysctl net.ipv4.tcp_sack
tc -s qdisc show dev enp5s0
ip route show
Linux elegant 6.18.0-mountain+ #6 SMP PREEMPT_DYNAMIC Tue Jan 13 20:25:12 KST 2026 x86_64 GNU/Linux
PRETTY_NAME="Debian GNU/Linux 13 (trixie)"
NAME="Debian GNU/Linux"
VERSION_ID="13"
VERSION="13 (trixie)"
VERSION_CODENAME=trixie
DEBIAN_VERSION_FULL=13.2
ID=debian
HOME_URL="https://www.debian.org/"
SUPPORT_URL="https://www.debian.org/support"
BUG_REPORT_URL="https://bugs.debian.org/"
net.ipv4.tcp_congestion_control = bbr3
net.core.default_qdisc = fq
net.ipv4.tcp_ecn = 2
net.ipv4.tcp_timestamps = 1
net.ipv4.tcp_sack = 1
qdisc fq 8001: root refcnt 2 limit 10000p flow_limit 100p buckets 1024 orphan_mask 1023 bands 3 priomap 1 2 2 2 1 2 0 0 1 1 1 1 1 1 1 1 weights 589824 196608 65536 quantum 3028b initial_quantum 15140b low_rate_threshold 550Kbit refill_delay 40ms timer_slack 10us horizon 10s horizon_drop offload_horizon 0us
 Sent 1722142299 bytes 1492478 pkt (dropped 0, overlimits 0 requeues 0)
 backlog 0b 0p requeues 0
  flows 66 (inactive 66 throttled 0) band0_pkts 0 band1_pkts 0 band2_pkts 0
  gc 8 highprio 0 fastpath 427890 throttled 172135 latency 11.8us
default via 192.168.168.1 dev enp5s0 proto dhcp src 192.168.168.102 metric 100
192.168.168.0/24 dev enp5s0 proto kernel scope link src 192.168.168.102 metric 100
root@elegant:/home/yjlee#
I am embedding test scripts here to enhance accessibility.
#!/usr/bin/env bash
set -euo pipefail

# Public iPerf3 CC switch benchmark: bbr3 -> bbr3vanilla -> bbr3
# This script selects the best server once and fixes it for the entire session.
# Logs: iperf3 forward/reverse + ping during load (WAN_PING_TARGET)

########################################
# Config (override via env vars)
########################################
WAN_PING_TARGET="${WAN_PING_TARGET:-8.8.8.8}"

# iPerf3 parameters
DURATION="${DURATION:-30}"
PARALLEL="${PARALLEL:-4}"
WARMUP="${WARMUP:-3}"
MAX_RETRIES=5          # Retries per direction if server is busy
RETRY_DELAY=5         # Seconds to wait between retries

# Ping parameters
PING_INTERVAL="${PING_INTERVAL:-0.2}"
PING_TIMEOUT="${PING_TIMEOUT:-2}"

# CC sequence: bbr3 -> bbr3vanilla -> bbr3
CC_SEQ=("bbr3" "bbr3vanilla" "bbr3")

# Result directory
RESULT_DIR="${RESULT_DIR:-results_bbr_fixed_session}"
mkdir -p "$RESULT_DIR"

########################################
# Server Candidates (Prioritizing KR/JP)
########################################
SERVER_CANDIDATES=(
  "146.56.145.150 5201 KR-Oracle-Seoul"
  "kr.iperf.biz 5201 KR-Community-Node"
  "iperf.idcf.jp 5201 JP-Tokyo-IDCF"
  "speedtest.tokyo.linode.com 5201 JP-Tokyo-Linode"
#  "speedtest.uztelecom.uz 5201 UZ-Tele"
  "bouygues.iperf.fr 9201 FR-Bytel-BBR"
  "ping.online.net  5200 FR-Scaleway"
  "ping.online.net  5200 FR-Moji"
)

########################################
# Helpers
########################################
log() { echo -e "[$(date +'%H:%M:%S')] $1"; }

need_cmd() {
  command -v "$1" >/dev/null 2>&1 || { log "[!] Missing command: $1"; exit 1; }
}

as_root() {
  if [[ "${EUID:-$(id -u)}" -ne 0 ]]; then log "[!] Please run as root"; exit 1; fi
}

sysctlw() { sysctl -w "$1" >/dev/null 2>&1 || true; }
sysctlq() { sysctl -n "$1" 2>/dev/null || echo "unknown"; }

tcp_probe() {
  local host="$1" port="$2"
  timeout 2 bash -c "cat < /dev/null > /dev/tcp/${host}/${port}" >/dev/null 2>&1
}

ping_avg_ms() {
  local host="$1"
  local out avg
  out="$(ping -c 3 -W 1 "$host" 2>/dev/null || true)"
  avg="$(echo "$out" | awk -F'/' '/rtt|round-trip/ {print $5}')"
  echo "${avg:-999999}"
}

########################################
# Server Selection (Fixed for the session)
########################################
pick_and_fix_server() {
  local best_host="" best_port="" best_label="" best_rtt="999999"
  log "Scanning candidates to fix a server for this session..."

  for entry in "${SERVER_CANDIDATES[@]}"; do
    read -r host port label <<< "$entry"

    if ! getent hosts "$host" >/dev/null 2>&1; then continue; fi
    if ! tcp_probe "$host" "$port"; then continue; fi

    local rtt
    rtt=$(ping_avg_ms "$host")
    log "  Found: $label ($host) - RTT: ${rtt}ms"

    if awk "BEGIN{exit !($rtt < $best_rtt)}"; then
      best_rtt=$rtt; best_host=$host; best_port=$port; best_label=$label
    fi
  done

  if [[ -z "$best_host" ]]; then
    log "Error: No reachable servers found."
    exit 1
  fi

  FIXED_HOST=$best_host
  FIXED_PORT=$best_port
  FIXED_LABEL=$best_label
  log "==> SERVER FIXED: $FIXED_LABEL ($FIXED_HOST:$FIXED_PORT)"
}

########################################
# Benchmark Core with Retry
########################################
run_bench() {
  local outdir="$1"
  local direction="$2"
  local attempt=1
  local success=0

  local json_flag=""
  iperf3 -h 2>&1 | grep -q -- '--json' && json_flag="--json"

  local ping_count
  ping_count="$(awk "BEGIN{print int(($DURATION / $PING_INTERVAL) + 10))}")"

  while [ $attempt -le $MAX_RETRIES ]; do
    log "    -> [$direction] Attempt $attempt/$MAX_RETRIES"

    # Background ping during load
    ping -i "$PING_INTERVAL" -W "$PING_TIMEOUT" -c "$ping_count" "$WAN_PING_TARGET" \
      > "${outdir}/ping_${direction}.log" 2>&1 &
    local ppid=$!

    # Run iperf3
    local cmd="iperf3 -c $FIXED_HOST -p $FIXED_PORT -t $DURATION -P $PARALLEL $json_flag"
    [[ "$direction" == "reverse" ]] && cmd="$cmd -R"

    set +e
    $cmd > "${outdir}/iperf3_${direction}.log" 2> "${outdir}/iperf3_${direction}.err"
    local rc=$?
    set -e

    wait "$ppid" >/dev/null 2>&1 || true

    if [[ $rc -eq 0 ]]; then
      log "       Success!"
      success=1; break
    else
      log "       Server Busy or Network Error. Waiting ${RETRY_DELAY}s..."
      sleep "$RETRY_DELAY"
    fi
    ((attempt++))
  done

  if [[ $success -eq 0 ]]; then
    log "    [!] Failed $direction after $MAX_RETRIES attempts."
    return 1
  fi
}

########################################
# Main Execution
########################################
as_root
need_cmd ip; need_cmd ping; need_cmd iperf3; need_cmd awk; need_cmd bc

# Load modules
modprobe tcp_bbr >/dev/null 2>&1 || true
modprobe tcp_bbr3 >/dev/null 2>&1 || true
modprobe tcp_bbr3vanilla >/dev/null 2>&1 || true

# Interface optimization
iface=$(ip route get "$WAN_PING_TARGET" 2>/dev/null | awk '{for(i=1;i<=NF;i++)if($i=="dev"){print $(i+1);exit}}')
if [[ -n "$iface" ]]; then
  log "Setting fq qdisc on $iface"
  tc qdisc replace dev "$iface" root fq 2>/dev/null || true
fi

# 1. Lock server for consistency
pick_and_fix_server

TS="$(date +%Y%m%d-%H%M%S)"
RUN_DIR="${RESULT_DIR}/${TS}_$(uname -r | tr ' ' '_')"
mkdir -p "$RUN_DIR"

# 2. Loop CC sequence
for cc in "${CC_SEQ[@]}"; do
  # Use sub-timestamp to avoid folder collision for repeated CCs
  cc_dir="${RUN_DIR}/${cc}_$(date +%H%M%S)"
  mkdir -p "$cc_dir"

  log "--------------------------------------------"
  log "Switching CC -> $cc"
  sysctlw "net.ipv4.tcp_congestion_control=$cc"

  actual=$(sysctlq net.ipv4.tcp_congestion_control)
  log "Current Kernel CC: $actual"

  sleep "$WARMUP"

  # Forward Test
  log "Running Forward (TX) test..."
  run_bench "$cc_dir" "forward"

  # Reverse Test
  log "Running Reverse (RX) test..."
  run_bench "$cc_dir" "reverse"
done

# Reset to default
sysctlw "net.ipv4.tcp_congestion_control=bbr3"
log "All tests finished. Results: $RUN_DIR"
#!/usr/bin/env bash
set -euo pipefail

# Ask whether this run is on vanilla kernel
read -r -p "vanilla? <Y/N> " ans
case "$ans" in
    Y|y) KTYPE="vanilla" ;;
    N|n) KTYPE="modified" ;;
    *) echo "Please answer Y or N" >&2; exit 1 ;;
esac

# Configuration (override with environment variables if needed)
LOCAL_TARGET="${LOCAL_TARGET:-192.168.168.102}"
WAN_TARGET="${WAN_TARGET:-1.1.1.1}"
PING_COUNT="${PING_COUNT:-1000}"
PING_INTERVAL="${PING_INTERVAL:-0.1}"   # seconds between pings
PING_WAIT_TIME="${PING_WAIT_TIME:-5}"

RESULT_DIR="${RESULT_DIR:-results_net_test}"
mkdir -p "$RESULT_DIR"

TS="$(date +%Y%m%d-%H%M%S)"
KERNEL="$(uname -r | tr ' ' '_')"
PREFIX="${RESULT_DIR}/${TS}_${KTYPE}_${KERNEL}"

echo "========================================"
echo " Kernel type      : $KTYPE"
echo " Kernel version   : $KERNEL"
echo " Local ping target: $LOCAL_TARGET"
echo " WAN ping target  : $WAN_TARGET"
echo " Result prefix    : $PREFIX"
echo "========================================"
echo

########################################
# 1. Long local ping test
########################################
echo "[1/4] Running long local ping test..."
echo "      ping -i ${PING_INTERVAL} -c ${PING_COUNT} ${LOCAL_TARGET}" -w ${PING_WAIT_TIME}
ping -i "$PING_INTERVAL" -c "$PING_COUNT" "$LOCAL_TARGET" \
    > "${PREFIX}_ping_local.log"
echo "      Saved to ${PREFIX}_ping_local.log"
echo

########################################
# 2. Long WAN ping test
########################################
echo "[2/4] Running long WAN ping test..."
echo "      ping -i ${PING_INTERVAL} -c ${PING_COUNT} ${WAN_TARGET}"
ping -i "$PING_INTERVAL" -c "$PING_COUNT" "$WAN_TARGET" \
    > "${PREFIX}_ping_wan.log"
echo "      Saved to ${PREFIX}_ping_wan.log"
echo

########################################
# 3. Throughput test with iperf3 (optional)
#    Set IPERF_TARGET to enable, e.g.:
#    export IPERF_TARGET=192.168.168.200
########################################
if command -v iperf3 >/dev/null 2>&1 && [ -n "${IPERF_TARGET:-}" ]; then
    echo "[3/4] Running iperf3 throughput tests to ${IPERF_TARGET}..."
    echo "      Reverse direction (server -> client)..."
    iperf3 -c "$IPERF_TARGET" -t 60 -R \
        > "${PREFIX}_iperf3_reverse.log"
    echo "      Saved to ${PREFIX}_iperf3_reverse.log"

    echo "      Forward direction (client -> server)..."
    iperf3 -c "$IPERF_TARGET" -t 60 \
        > "${PREFIX}_iperf3_forward.log"
    echo "      Saved to ${PREFIX}_iperf3_forward.log"
else
    echo "[3/4] Skipping iperf3 tests."
    echo "      Reason: iperf3 not installed or IPERF_TARGET not set."
    echo "iperf3 skipped: missing binary or IPERF_TARGET" \
        > "${PREFIX}_iperf3_skipped.txt"
fi
echo

########################################
# 4. Combined CPU stats + ping (turbostat)
########################################
if command -v turbostat >/dev/null 2>&1; then
    if [ "${EUID:-$(id -u)}" -ne 0 ]; then
        SUDO="sudo"
        echo "[4/4] turbostat found, will use sudo."
    else
        SUDO=""
        echo "[4/4] turbostat found, running as root."
    fi

    echo "      Collecting turbostat for 120 seconds..."
    echo "      and running ping to ${LOCAL_TARGET} at the same time."
    echo

    # Start turbostat in background
    ${SUDO} turbostat --interval 1 --num_iterations 120 \
        > "${PREFIX}_turbostat_120s.log" 2>&1 &
    TSTAT_PID=$!

    # While turbostat is running, run 600 pings (120s * 0.2s interval)
    ping -i 0.2 -c 600 "$LOCAL_TARGET" \
        > "${PREFIX}_ping_local_during_turbostat.log"

    # Wait for turbostat to finish
    wait "$TSTAT_PID" || true

    echo "      turbostat log: ${PREFIX}_turbostat_120s.log"
    echo "      ping log     : ${PREFIX}_ping_local_during_turbostat.log"
else
    echo "[4/4] turbostat not found, skipping CPU stats."
    echo "turbostat skipped: binary not found" \
        > "${PREFIX}_turbostat_skipped.txt"
fi

echo
echo "All tests finished."
echo "Result files are under: ${RESULT_DIR}"
echo "You can now reboot into the other kernel and run this script again."
Ping Test
Ping is ICMP, but queueing on the bottleneck link affects all traffic, so ping RTT/jitter is still a practical proxy for bufferbloat under load. This can still be a good metric to measure bufferbloat.
| Path | Metric | Vanilla BBRv3 | Modified BBRv3 | Δ (Mod-Van) | Improvement (↓ better) |
|---|---|---|---|---|---|
| LAN (ping 192.168.168.102, n=1000) | |||||
| LAN | Avg RTT (ms) | 0.023 | 0.017 | -0.006 | +26.8% |
| LAN | mdev (ms) | 0.032 | 0.009 | -0.023 | +71.9% |
| LAN | p99 RTT (ms) | 0.046 | 0.043 | -0.003 | +6.5% |
| LAN | p99.9 RTT (ms) | 0.152 | 0.058 | -0.094 | +61.8% |
| LAN | Max RTT (ms) | 0.962 | 0.059 | -0.903 | +93.9% |
| LAN | Loss (%) | 0.0 | 0.0 | 0.0 pp | 0.0 pp |
| WAN (ping 1.1.1.1, n=1000) | |||||
| WAN | Avg RTT (ms) | 5.830 | 5.791 | -0.039 | +0.7% |
| WAN | mdev (ms) | 0.841 | 0.201 | -0.640 | +76.1% |
| WAN | p99 RTT (ms) | 6.310 | 6.220 | -0.090 | +1.4% |
| WAN | p99.9 RTT (ms) | 12.818 | 6.341 | -6.477 | +50.5% |
| WAN | Max RTT (ms) | 30.600 | 7.220 | -23.380 | +76.4% |
| WAN | Loss (%) | 0.0 | 0.0 | 0.0 pp | 0.0 pp |
Percentages are computed as (Vanilla - Modified) / Vanilla. Positive means Modified is better (lower latency/jitter).
1000M Full Duplex
| Path | Metric | Vanilla BBRv3 | Modified BBRv3 | Δ (Mod-Van) | Improvement (↓ better) |
|---|---|---|---|---|---|
| LAN (ping 127.0.0.1, n=1000) | |||||
| LAN | Avg RTT (ms) | 0.01985 | 0.01770 | -0.00215 | +10.8% |
| LAN | mdev (ms) | 4.010 | 2.318 | -1.692 | +42.2% |
| LAN | Max RTT (ms) | 4.020 | 2.330 | -1.690 | +42.0% |
| WAN (ping 1.1.1.1, n=1000) | |||||
| WAN | Avg RTT (ms) | 5.784 | 5.764 | -0.020 | +0.35% |
| WAN | mdev (ms) | 1.640 | 1.440 | -0.200 | +12.2% |
| WAN | Max RTT (ms) | 6.560 | 6.540 | -0.020 | +0.30% |
Percentages are computed as (Vanilla - Modified) / Vanilla. Positive means Modified is better (lower latency/jitter).
As a result, RTT has improved significantly–something that would not happen if we only tweaked user-space applications. Now, let’s move on to the iPerf test, since BBRv3 does a lot more than BBRv1/v2, which I posted about before. In that previous post, I only attached a ping test, but now I am sharing an iPerf3 test for you.
IPerf3 Test
The server was fixed to ping.online.net:5200.
1000M Full Duplex
The server was fixed to ping.online.net:5200. The test was conducted on a 1000M Full Duplex router with a 500Mbps WAN link.
Raw
| Case | Forward throughput (Mbps) |
Reverse throughput (Mbps) |
Reverse retrans |
Fwd Latency avg (ms) |
Rev Latency avg (ms) |
|---|---|---|---|---|---|
| bbr3_135852 | 332.85 | 401.77 | 93,315 | 23.50 | 25.62 |
| bbr3_140147 | 334.20 | 426.41 | 152,655 | 23.50 | 26.95 |
| bbr3vanilla (Baseline) | 252.71 | 428.47 | 188,474 | 23.56 | 27.38 |
Analysis
| Metric (Forward) | Vanilla (BBR3 Baseline) | Modified (BBR3 Optimized) | Improvement |
|---|---|---|---|
| Throughput (Recv) | 252.71 Mbps | 334.20 Mbps | +32.25% |
| Latency (Avg) | 23.56 ms | 23.50 ms | +0.25% (Reduced) |
| Metric (Reverse) | Vanilla (BBR3 Baseline) | Modified (BBR3 Optimized) | Improvement |
|---|---|---|---|
| TCP Retransmissions | 188,474 | 93,315 | +50.49% (Reduced) |
As you can see, forward throughput increased by roughly 32% while reverse retransmissions decreased by over 50%. This indicates that the tuning effectively balances the congestion window, preventing excessive packet loss without sacrificing (and even improving) forward throughput in this scenario. This result suggests that the “brake pedal” logic works well even in higher bandwidth environments, maintaining stability and efficiency.
100M Full Duplex
Raw
When running test 112620, public IPerf3’s response was broken for 4 attempts. This shows a behavior when network quality is poor.
| Case | Forward recv (Mbps) |
Reverse recv (Mbps) |
Forward retrans |
Reverse retrans |
Ping fwd avg (ms) |
Ping fwd max (ms) |
Ping rev avg (ms) |
Ping rev max (ms) |
|---|---|---|---|---|---|---|---|---|
| bbr3_112401 | 84.99 | 87.31 | 342 | 35734 | 25.96 | 43.69 | 27.49 | 65.29 |
| bbr3_112620 (worst case) |
84.01 | 87.90 | 671 | 43481 | 27.69 | 46.41 | 26.82 | 46.99 |
| bbr3vanilla_112511 | 81.23 | 87.80 | 580 | 42012 | 28.71 | 73.05 | 29.17 | 46.19 |
Analysis
| Metric (Forward) | Vanilla (BBR3 Baseline) | Modified (BBR3 Optimized) | Improvement |
|---|---|---|---|
| Throughput (Recv) | 81.23 Mbps | 84.99 Mbps | +4.63% |
| TCP Retransmissions | 580 | 342 | +41.03% (Reduced) |
| Avg Latency (Ping) | 28.71 ms | 25.96 ms | +9.58% (Reduced) |
| Max Latency (Jitter) | 73.05 ms | 43.69 ms | +40.19% (Reduced) |
As you can see, max latency has improved by 40%, while throughput increased by 4%. Average latency has improved by 9% with this tweak, even though Google is generally known for high-performance tuning. This shows that every case has its own niche points, even though many methods are developed by renowned corporations. Since the CWND management logic acted as a brake pedal, it does not affect the balanced options of BBRv3 much; if you are planning to tune your kernel, I recommend you stay within your own safe zone.
What can be the direction of my tuning?
My safe zone was not to accept packets aggressively. Personally, I concluded that preventing bufferbloat is more important than aggressively allowing packets to increase throughput (like an old Korean proverb: You may burn your house down when you try to burn bedbugs).
Consequently, in my case, I reduced the speed of certain parts that are usually considered conservative tuning. But some aggressive tuning decreases pacing to obtain better responsiveness, which I wouldn’t do for my server.
If you are a skilled engineer, you may add those sorts of tunings to squeeze a dry towel.
Risks and Trade-offs
This tweak is intentionally biased toward latency stability rather than maximizing raw throughput. That implies trade-offs:
-
Potential throughput reduction: Reducing pacing and/or CWND more aggressively can underutilize capacity on clean links, especially on high-BDP paths where a larger steady-state window is required.
-
Sensitivity to measurement noise: Bandwidth samples can fluctuate due to cross-traffic, ACK compression, or transient scheduling effects. A policy that reacts to short-term drops can become overly conservative unless thresholds and smoothing are well chosen.
-
Workload dependence: The benefits are most visible when queueing and tail latency matter (interactive or latency-sensitive services). For bulk transfer workloads, the same behavior may not be desirable.
-
Portability across kernel versions: Even if the idea is stable, field names, internal invariants, and pacing/cwnd coupling differ across kernel versions. A port must be reviewed against the target version’s BBRv3 implementation details to avoid unintended behavior.
-
Regression risk on specific paths: Some networks (e.g., paths with unusual buffering, intermittent loss, or variable RTT) may respond poorly to conservative pacing clamps. The safe approach is to validate on representative production-like paths before relying on the tweak.
If your goal is minimal bufferbloat and better tail latency under contention, these trade-offs can be acceptable. If your goal is peak throughput on clean links, the default behavior may be preferable.